What is the Pacific Data Visualisation Challenge?
Convert regional open data into compelling visual narratives. The initiative seeks to clarify, engage with, and promote action on intricate social, economic, and environmental challenges in the Pacific region.
The process
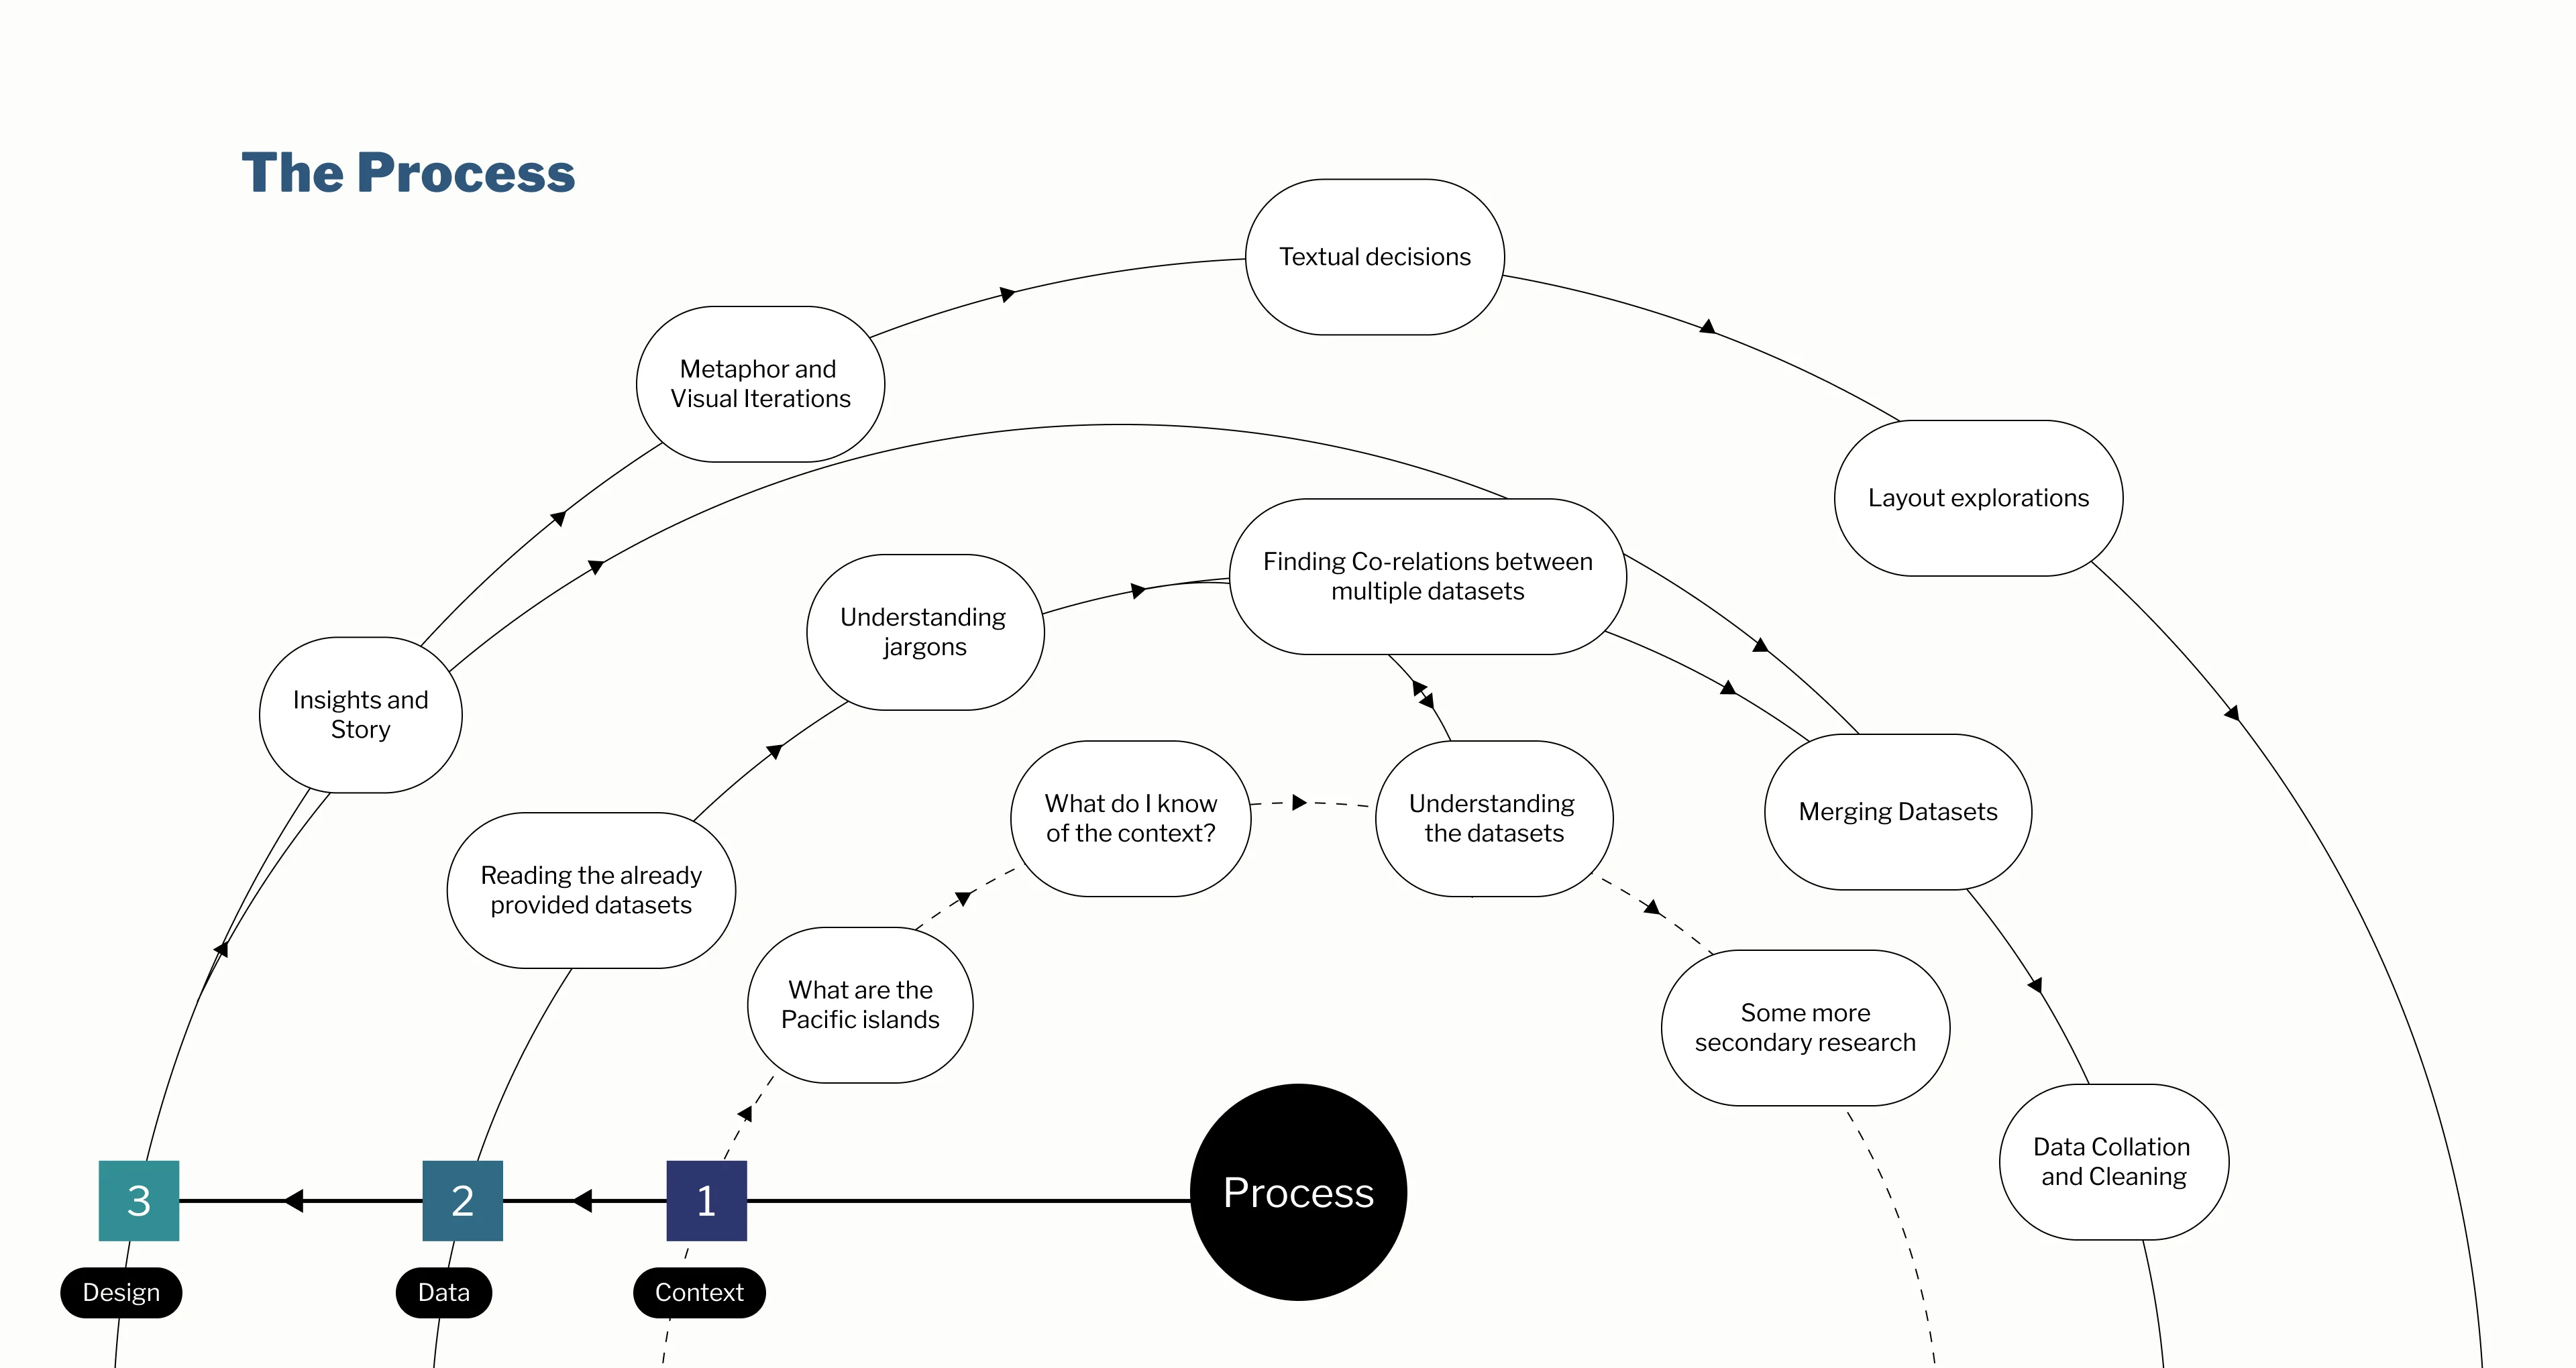
Three stages. Context: what are the Pacific islands, what do I know of the context, reading the already provided datasets, understanding jargons. Data: understanding the datasets, finding correlations between multiple datasets, some more secondary research, data collation and cleaning, merging datasets. Design: insights and story, metaphor and visual iterations, textual decisions, layout explorations.
Data
1. The endemics: endemic species in the Pacific are plants, animals, and other organisms that are naturally found only in a particular, limited geographical area, such as an island, an archipelago, or a specific region, and do not exist anywhere else in the world.
2. Red List Index: the Red List Index (RLI) is a measure used to track changes in the overall extinction risk of species over time. It is based on the conservation status of species assessed by the International Union for Conservation of Nature (IUCN).
Pacific Island species are more prone to extinction due to a combination of high levels of unique endemic life, extreme isolation, and fragile ecosystems that cannot cope with sudden human and environmental pressures.
The poster
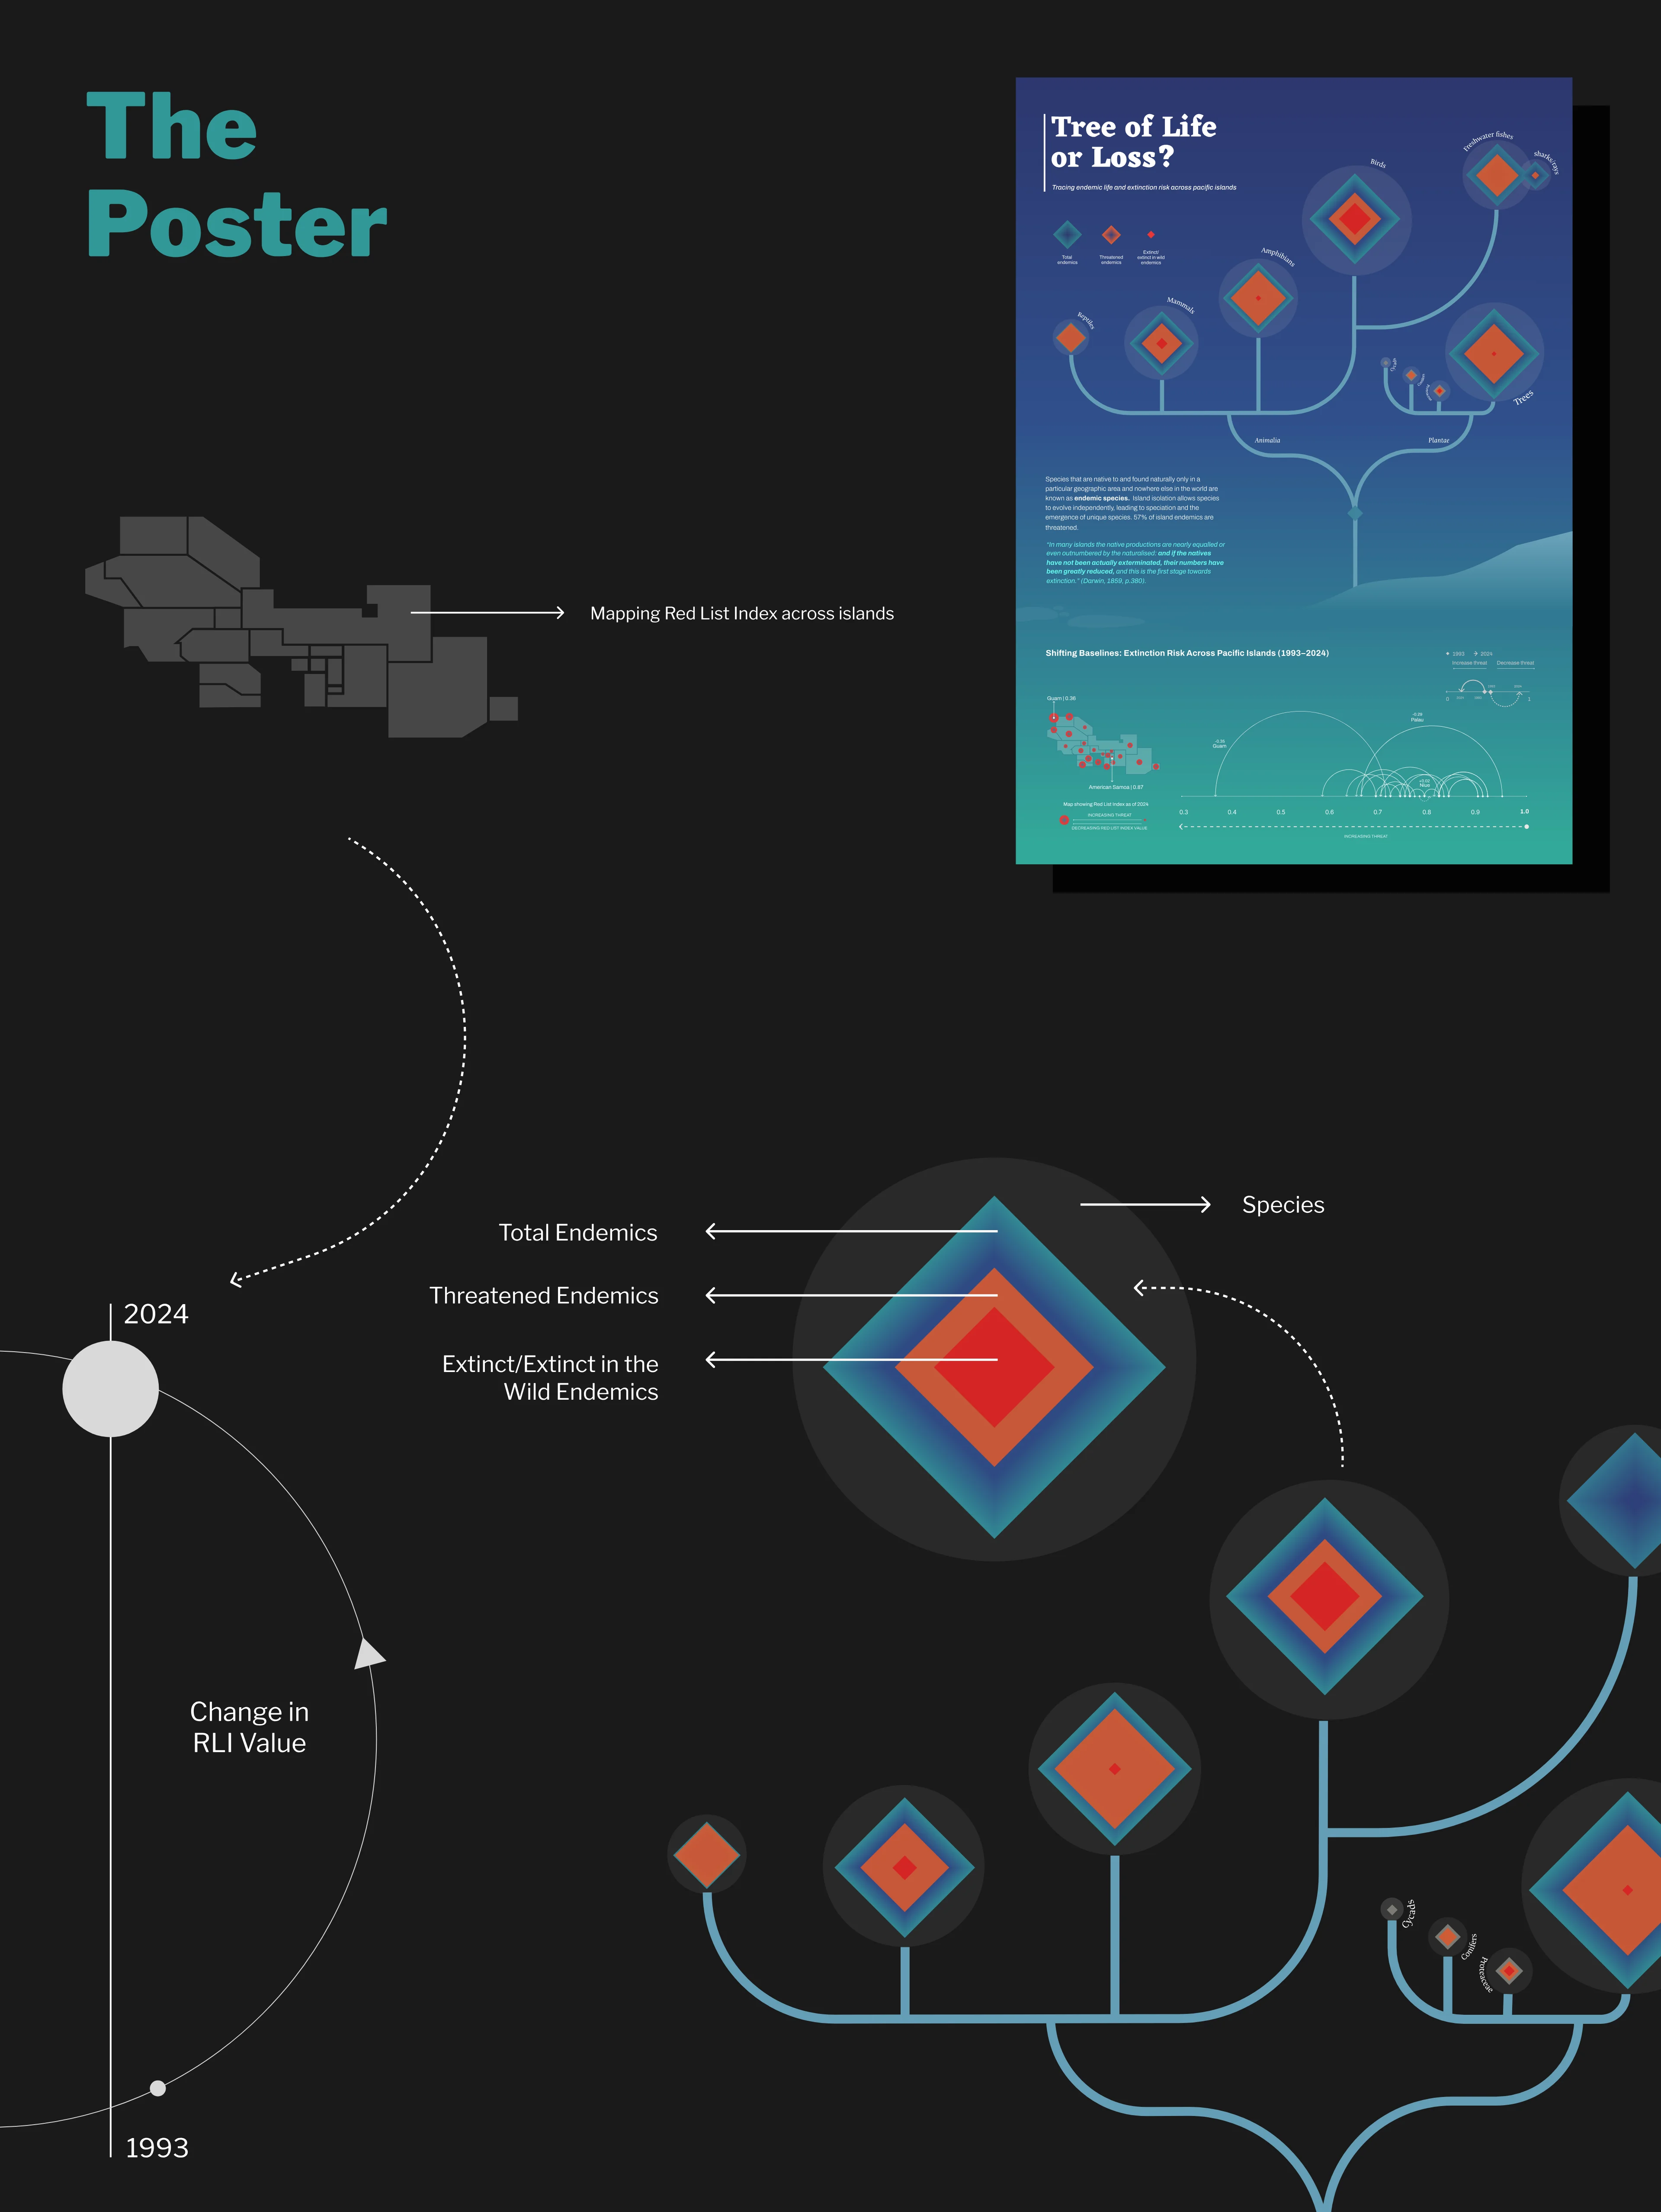
Tree of Life or Loss? The Red List Index is mapped across islands. Each island is a branch on the tree; each diamond shows total endemics, threatened endemics, and extinct or extinct-in-the-wild endemics for its species, and the ring around it shows the change in RLI value from 1993 to 2024.
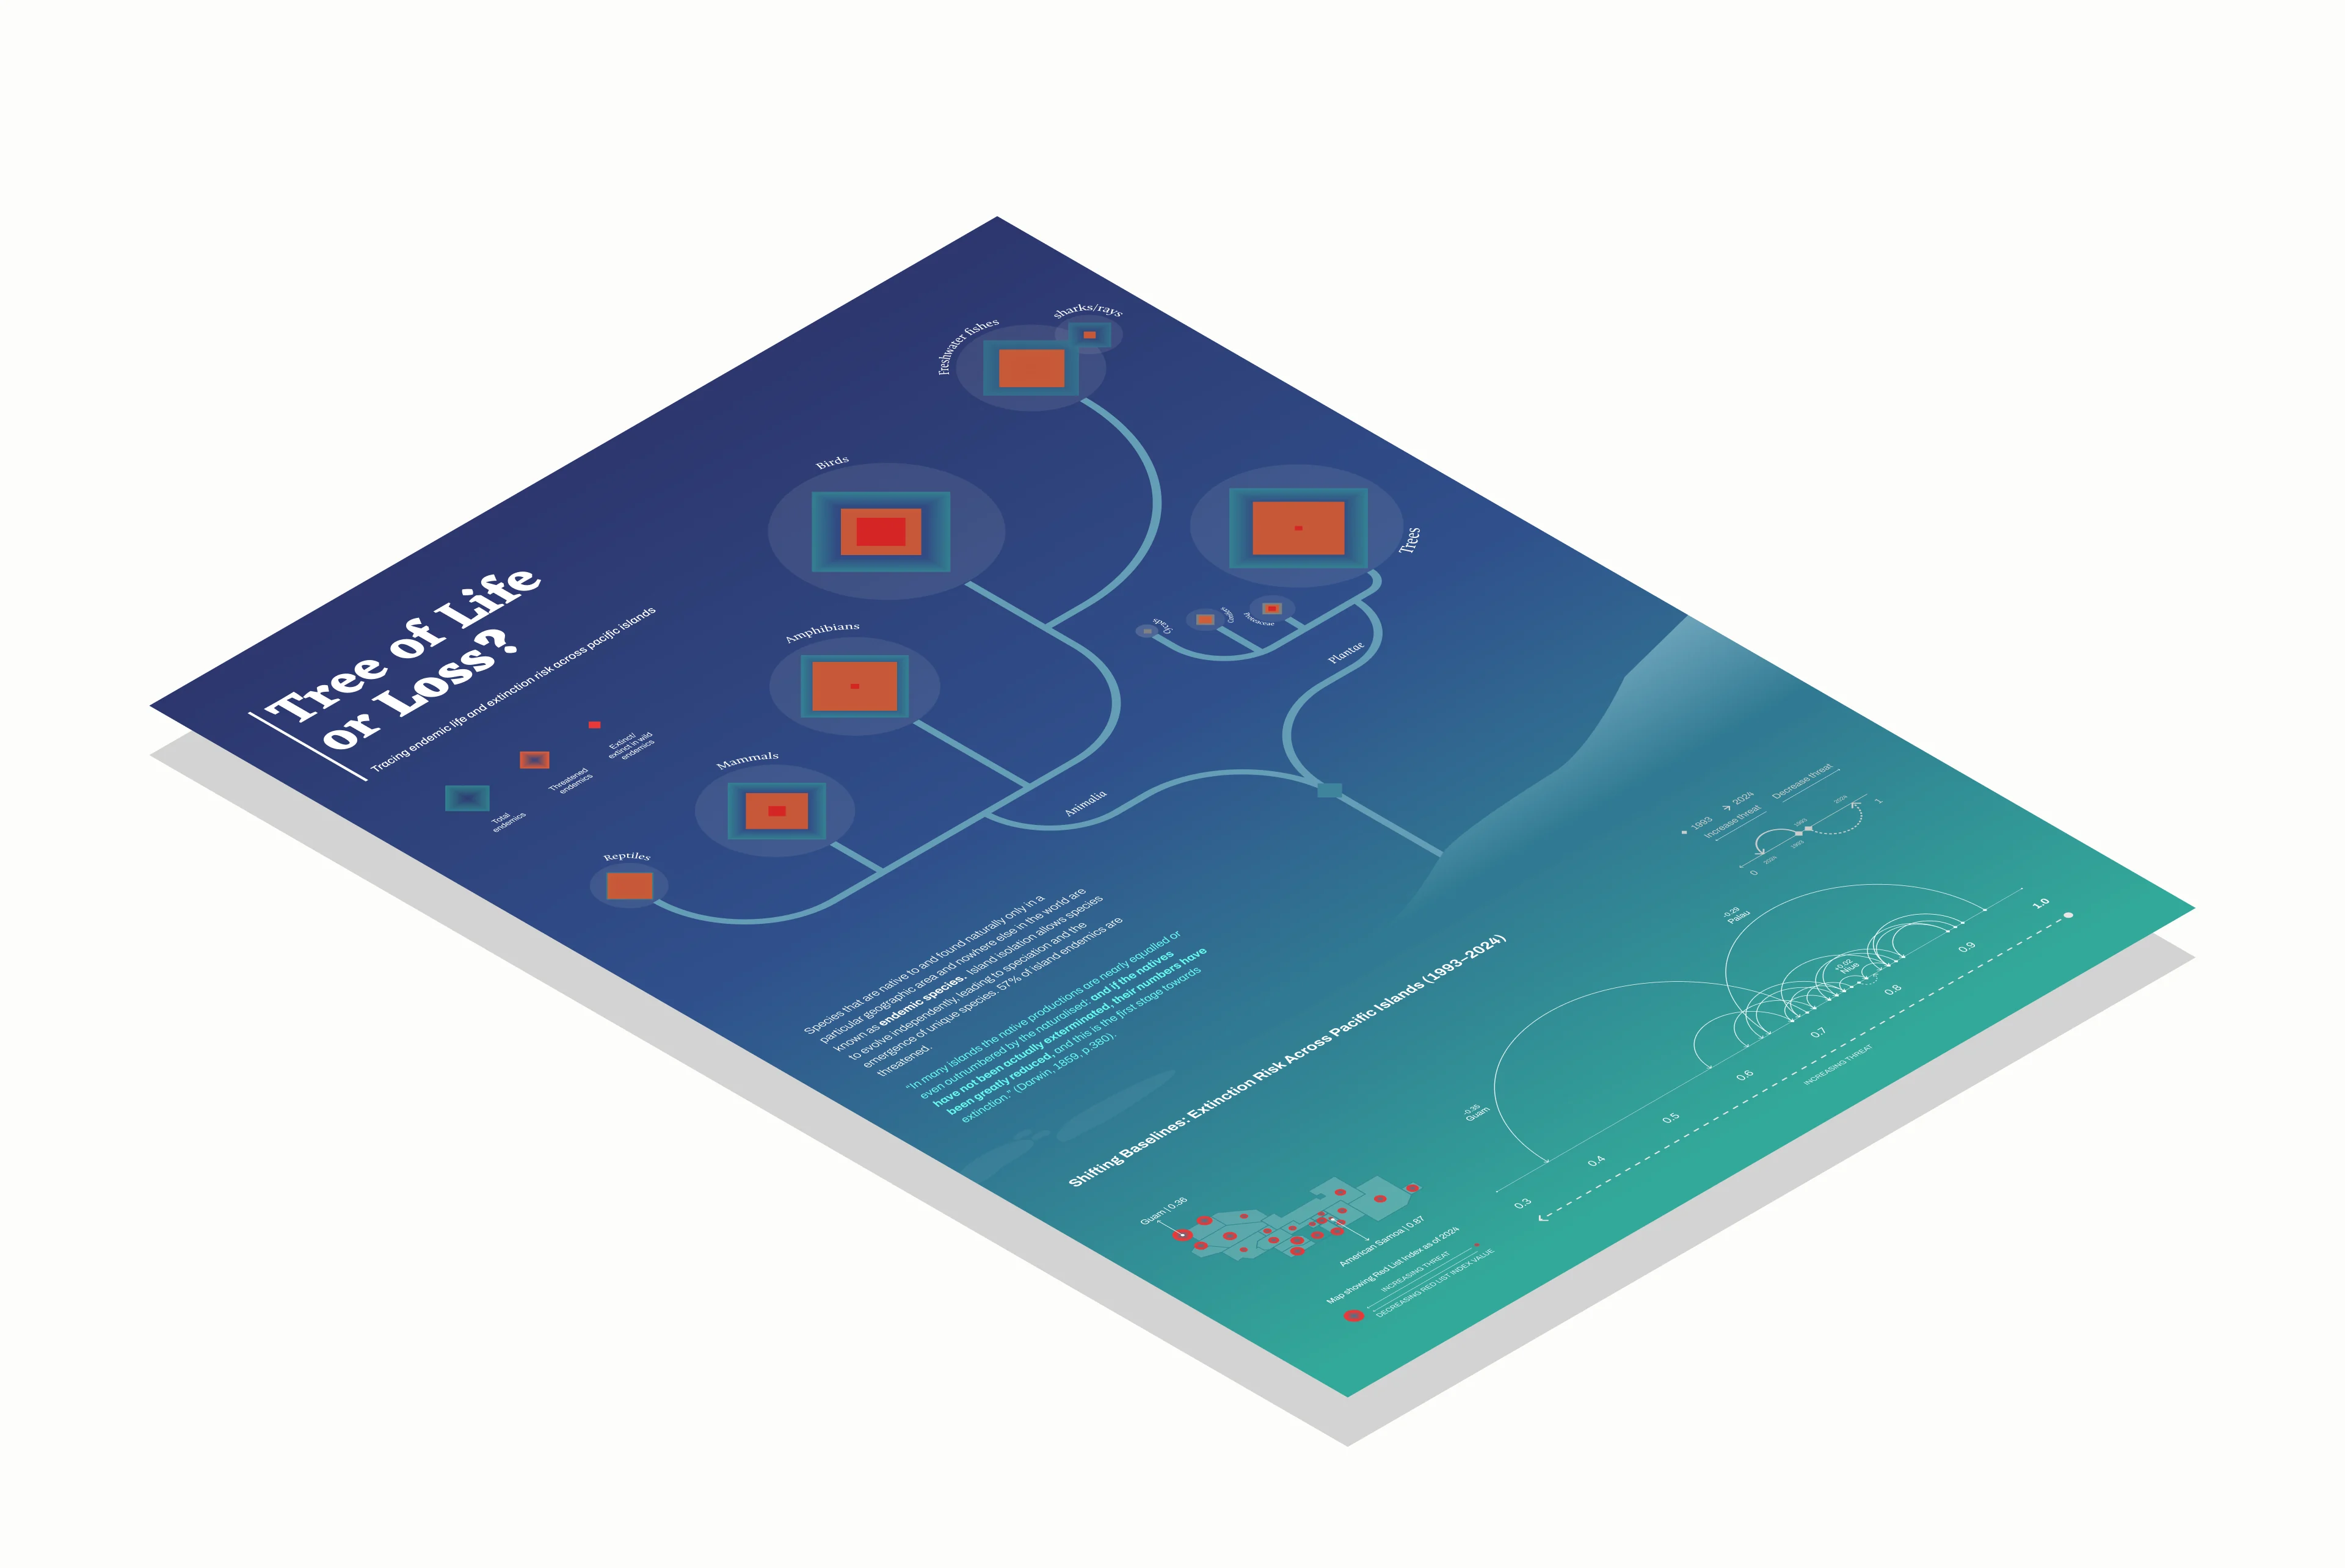
The final poster, Tree of Life or Loss?, shown in perspective.